How-to
How to use reports
Pledger.io generates several reports from your transactions. Open Reports in the left navigation to see the available report types. Most reports can be viewed per year or per month using the period selector in the header.
Income & expense report
The income and expense report compares what you earned with what you spent per month.
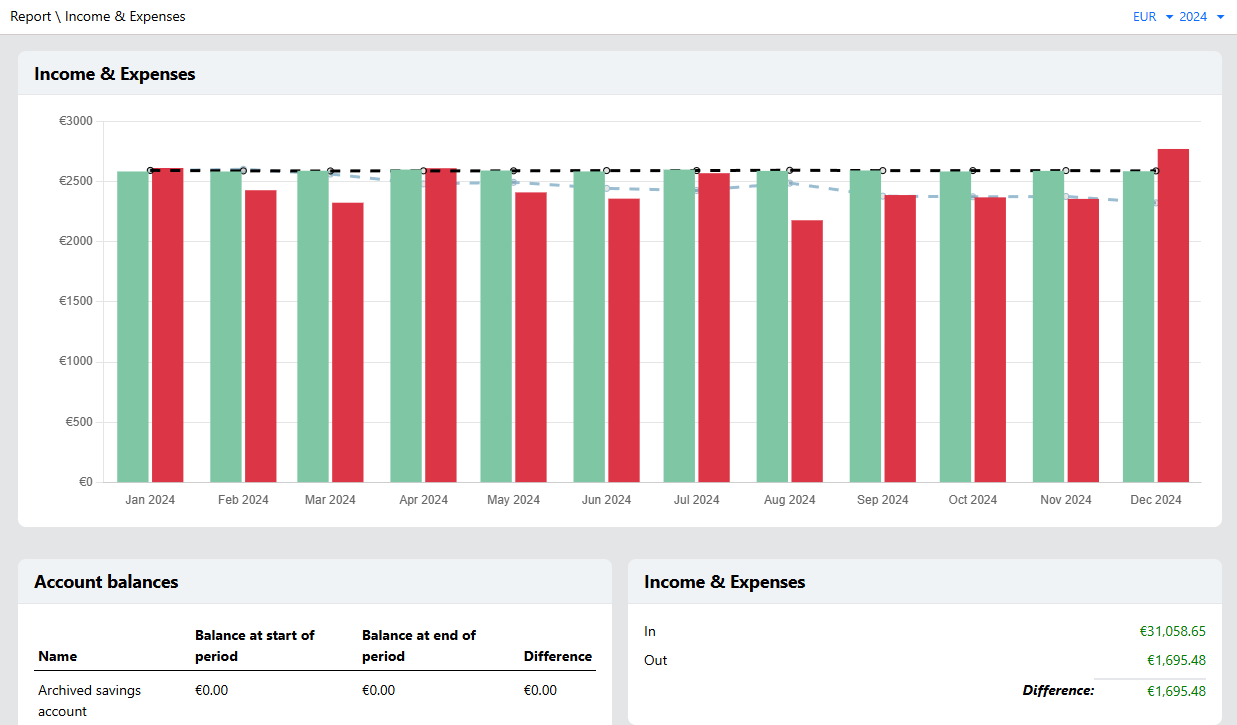
Below the chart, the report lists your account balances at the start and end of the period, including the difference, and the total income and expenses for the period.
Monthly category report
The monthly category report breaks your spending down per category. Use it to spot which categories take up most of your money in a given month.
Monthly budget report
The monthly budget report shows your budget performance over the year: what you planned to spend per expense group versus what you actually spent.
Spending insights
The spending insights report analyzes your transaction history and highlights things worth your attention, such as unusual spending and recurring patterns. Open it under Reports → Spending insights and pick the month to review.
The page has two tabs:
- Insights, detected anomalies and noteworthy changes, each with a type, severity, and score.
- Patterns, recurring spending behavior Pledger.io recognized, each with a confidence level.
Use the search field and the type, severity, score, and confidence filters to narrow down the results.
Note
Spending insights are computed in the background. The longer your transaction history, the more reliable the detected patterns become.